In the series of articles (De-multiplexing of E1 streams in Java, De-multiplexing of E1 stream: converting to C, Fast E1 de-multiplexing in C using SSE/AVX) we optimised de-multiplexing of E1 streams, first in Java, then in C++. We tested it on Intel® Xeon® CPU E5-2670 @ 2.60GHz (a Sandy Bridge architecture). The achieved de-multiplexing speed is 18.8 Gbytes/sec, or 73,400 times faster than real time. In the process of optimisation we improved the speed by the factor of 12.
It would be nice if this result meant that we could process 73,400 streams simultaneously. But we do not expect that, because our tests were conducted in very unrealistic environment – when both source data and the result were in the L1 cache. The real life is usually closer to another extreme – when no data is in any level of cache at all. In particular, this is exactly the case for the data that has just arrived from some device via DMA.
The caches
The Sandy Bridge processor has three levels of cache:
- Level 1 (L1) cache has a size of 32K bytes per core and a latency of 4 CPU cycles (this is a time required to read a value in case of a cache miss)
- Level 2 (L2) cache has a size of 256K bytes per core and a latency of 11 CPU cycles
- Level 3 (L3) cache is shared between all the cores and has a size of 20M bytes and a latency of 30-40 cycles.
Finally, the RAM has a latency of 150-300 cycles.
There is also penalty for TLB miss, but we’ll postpone study of TLB for later.
We see that any cache miss affects us negatively, but L3 miss is a complete disaster. Fortunately, things are not totally bad. Firstly, we are talking about latency, not throughput. If one memory read finished in 11 cycles, it does not mean that two reads will require 22. It is possible that several memory accesses may interleave in time (although it is not explicitly mentioned in Intel manuals). Secondly, the out-of-order execution model of the processor allows it to do something useful while waiting for data from caches or memory. If all else fails, it can use its execution units for another thread if Hyperthreading is turned on (this isn’t our case, though, since we are running a single thread). And finally, there is prefetch – the processor detects pattern of memory access and starts fetching the data before it becomes necessary. However, I still expect big performance degradation for data that does not fit in cache.
The test
The original test took a 2K buffer and wrote result in 32 output buffers, 64 bytes each. We’ll modify our test: we’ll allocate a big number of source buffers and appropriate number of destination buffers. We’ll then process the buffers in a round-robin way. The total amount of memory must be big enough to make sure that the buffer is evicted from the cache before it is used next time. We’ll vary the number of buffers to track what happens when we cross the boundaries of all the three caches.
The total number of source buffers will be 220 = 1048576 (total size 2Gb). Previously we ran our tests with the execution count of one million. Now we’ll use 1048576 as our iteration count. We’ll double the buffer count and half the execution count to keep results comparable.
This is how we allocate memory:
byte * generate (size_t count)
{
    byte * buf = (byte*)_mm_malloc(SRC_SIZE * count, 32);
    memset(buf, 0xEE, SRC_SIZE * count);
    return buf;
}

byte ** allocate_dst(size_t count)
{
    byte * buf = (byte*)_mm_malloc(SRC_SIZE * count, 32);
    byte ** result = new byte * [NUM_TIMESLOTS * count];
    for (size_t i = 0; i < NUM_TIMESLOTS * count; i++) {
        result[i] = buf + i * DST_SIZE;
    }
    return result;
}
And this is the test procedure:
byte * generate (size_t count)
{
    byte * buf = (byte*)_mm_malloc(SRC_SIZE * count, 32);
    memset(buf, 0xEE, SRC_SIZE * count);
    return buf;
}

byte ** allocate_dst(size_t count)
{
    byte * buf = (byte*)_mm_malloc(SRC_SIZE * count, 32);
    byte ** result = new byte * [NUM_TIMESLOTS * count];
    for (size_t i = 0; i < NUM_TIMESLOTS * count; i++) {
        result[i] = buf + i * DST_SIZE;
    }
    return result;
}
void measure(const Demux & demux)
{
    printf("%-30s:", typeid (demux).name());
    unsigned iterations = ITERATIONS;

    for (unsigned count = MIN_COUNT; count <= MAX_COUNT; count *= 2) {
        unsigned step = MAX_COUNT / count;
        uint64_t t0 = currentTimeMillis();
        for (unsigned i = 0; i < iterations; i++) {
            for (unsigned j = 0; j < count; j++) {
                demux.demux(src + SRC_SIZE * j, SRC_SIZE,
                            dst + NUM_TIMESLOTS * j);
            }
        }
        uint64_t t = currentTimeMillis() - t0;
        printf("%5d", t);
        iterations /= 2;
    }
    printf ("\n");
}
The test program is in repository.
The expectations
I expect three sharp performance drops with nearly constant performance in between. I can’t predict the exact magnitude of the drops, but I expect them to be substantial, something between 1.5 – 2 times slowdown for L1 cache miss to 10 – 20 times for L3 miss.
Such a slowdown may invalidate all our optimisations – if unoptimised test runs for 1500ms and optimised one for 150ms, and cache misses add 10,000 ms to both, the difference will be too small to justify sophisticated optimisations.
It is also possible that cache misses will change relative performance of different versions.
The results
Here is the output of the test program. For convenience, I added a line with memory sizes (it shows the total combined size of the input and the output). I ran the test for all the versions, including null ones (direct copy).
                                  4k   8k  16k  32k  64k 128k 256k 512k   1m   2m   4m   8m  16m  32m  64m 128m 256m 512m   1g   2g   4g
9Reference                    : 1494 1493 1494 1513 1527 1527 1538 1552 1552 1554 1554 1553 1564 1718 1724 1725 1730 1739 1756 1789 1852
11Src_First_1                 : 1121 1109 1126 1168 1235 1233 1249 1270 1269 1269 1269 1270 1278 1426 1430 1431 1430 1432 1433 1432 1433
11Src_First_2                 : 1126 1150 1172 1159 1244 1254 1283 1295 1295 1301 1301 1300 1309 1460 1465 1463 1465 1467 1466 1466 1467
11Src_First_3                 : 1494 1492 1510 1513 1531 1532 1539 1552 1552 1555 1556 1554 1563 1715 1720 1719 1719 1722 1721 1723 1722
11Dst_First_1                 : 1079 1071 1196 1193 1256 1257 1267 1277 1278 1279 1279 1277 1284 1405 1407 1408 1407 1409 1411 1411 1410
11Dst_First_2                 :  800  802  800  800  801  802  818  832  834  835  833  833  840  969  970  973  973  978  980  981  982
11Dst_First_3                 : 1047 1048 1192 1211 1240 1241 1255 1264 1263 1263 1261 1262 1266 1385 1387 1389 1389 1391 1393 1393 1394
12Dst_First_1a                :  804  803  802  802  803  803  820  833  833  834  833  833  836  969  971  972  973  978  981  983  984
12Dst_First_3a                :  723  724  726  745  769  770  790  809  808  808  808  808  812  952  954  957  957  964  967  969  970
10Unrolled_1                  :  725  712  714  730  769  770  785  804  804  804  805  804  810  953  954  958  958  965  971  973  974
12Unrolled_1_2                :  716  718  709  737  769  771  788  805  806  805  805  805  809  953  956  957  959  965  970  972  974
12Unrolled_1_4                :  675  673  676  707  742  744  764  789  789  789  788  789  793  930  932  934  934  942  946  948  949
12Unrolled_1_8                :  673  673  672  708  741  743  764  787  787  787  787  787  790  934  936  939  939  948  952  955  956
13Unrolled_1_16               :  673  672  673  708  742  744  762  783  782  782  782  781  786  923  925  927  927  934  938  940  941
15Unrolled_2_Full             :  673  673  674  708  742  745  763  783  782  783  782  781  786  923  925  927  928  934  938  940  942
6Write4                       :  567  568  563  568  586  586  601  614  613  614  613  613  617  753  755  756  756  762  765  765  766
6Write8                       :  547  549  550  557  575  576  591  603  602  604  602  602  606  734  735  736  737  741  743  744  744
12Read4_Write4                :  719  719  719  723  730  731  754  769  770  770  768  768  771  920  926  928  928  931  934  934  936
19Read4_Write4_Unroll         :  674  675  673  676  681  683  706  724  723  723  723  722  724  874  878  881  880  883  886  886  887
16Read4_Write4_SSE            :  254  254  250  259  274  275  299  334  334  334  333  333  338  571  578  582  581  588  590  592  592
17Read4_Write16_SSE           :  157  157  157  160  181  181  200  232  231  231  232  231  237  435  442  444  443  451  455  458  458
17Read8_Write16_SSE           :  132  131  131  135  146  147  163  199  200  200  200  200  205  412  418  420  419  426  431  432  433
24Read8_Write16_SSE_Unroll    :  128  127  127  132  145  146  164  198  199  199  199  199  205  411  417  419  418  426  431  433  435
18Read16_Write16_SSE          :  184  195  196  198  205  205  221  251  252  252  252  252  257  497  505  507  507  513  516  518  518
25Read16_Write16_SSE_Unroll   :  172  173  173  179  190  192  214  250  252  251  251  251  258  519  529  530  530  537  541  543  543
17Read4_Write32_AVX           :  150  152  150  155  175  175  193  225  224  225  224  225  230  425  429  431  431  441  445  448  449
17Read8_Write32_AVX           :  121  121  121  125  142  143  162  195  197  196  196  196  202  426  432  435  433  441  445  447  448
24Read8_Write32_AVX_Unroll    :  119  120  119  123  140  140  158  196  197  197  196  197  203  419  425  427  426  434  439  440  442
4Copy                         :   90   91   92  112  124  125  145  182  184  183  183  184  187  352  356  358  358  365  370  371  372
8Copy_AVX                     :   47   47   51   78  102  105  118  165  165  166  165  166  171  357  362  364  364  372  377  379  380
Let’s plot the data on the graph:
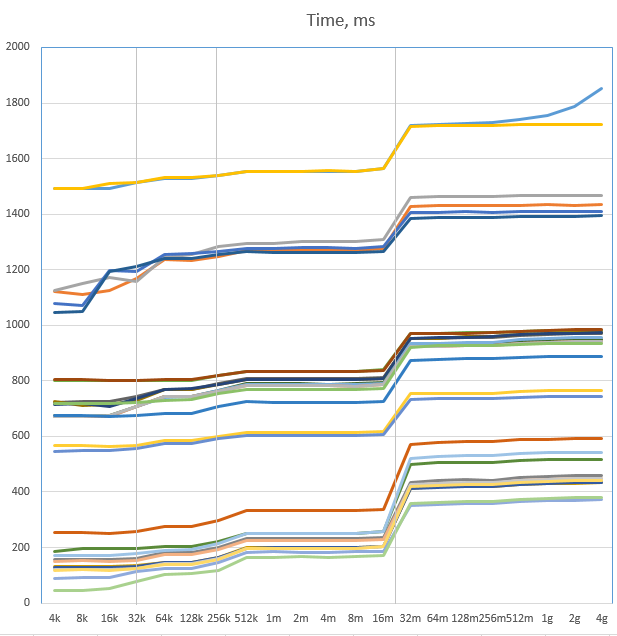
We can see three performance drops, as predicted, where the size crosses the cache boundaries (marked as grey vertical lines).
However, these drops are not nearly as bad as expected. Nothing close to expected 10-20 times slowdown. The increase in time is nearly
constant – 200 to 300 ms added for L3 cache miss to all the times. Obviously, the relative increase is much higher
for fast versions than for slow ones: the Reference version ran 25% slower than before, while Read8_Write32_AVX_Unroll
ran 3.7 times slower. However, this “slower” case is still three times faster than the “fast” case of Reference.
This means that, in general, our optimisation effort wasn’t in vain at all.
However, the prediction about relative performance of different versions happened to be correct. We can see that
cache misses have changed the champion. The fastest version now is Read8_Write16_SSE with 433 ms and not Read8_Write32_AVX_Unroll
which is 439 (they were, respectively, 132 ms and 119 ms when in L1 cache). Let’s magnify the part of the graph with
the fastest versions:
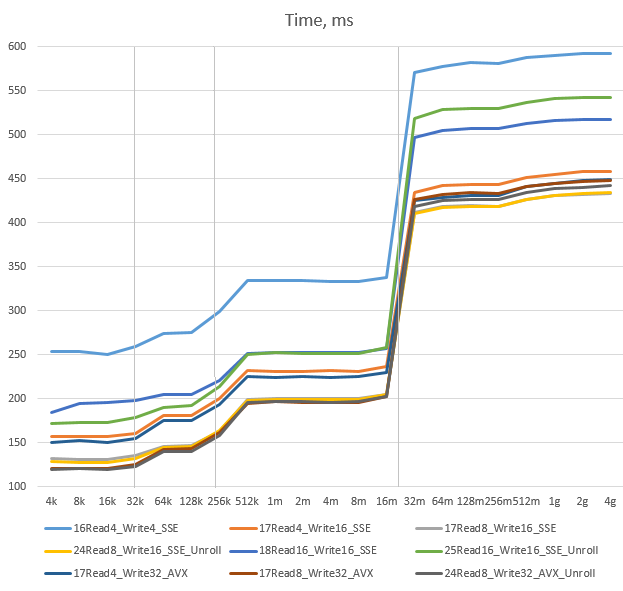
We see that in the left side of the graph there is the slowest version (Read4_Write4_SSE), a group of four
medium-speed versions and four of the fastest. The fastest are:
Read8_Write32_AVX_Unroll– 119 msRead8_Write32_AVX– 121 msRead8_Write16_SSE_Unroll– 128 msRead8_Write16_SSE– 132 ms
They are very close to each other. This separation
stays the same after crossing of L1 cache boundary (just the fastest versions get closer to each other). It also
survives crossing of L2 cache boundary. The L3 boundary, however, causes some re-grouping. The slowest version
stays the slowest, two of the medium ones stay in the medium group (but swap positions there), the other two
(Read4_Write16_SSE and Read4_Write32_AVX) join the fastest group. What it means is that the statement about
invalidation of optimisation effort is partially true. While optimisation in general still proved to be useful,
the extreme effort did not. The AVX-based versions are more complex than the SSE-based ones, they require
an AVX-capable processor and 32-byte alignment of data, but only really help in the fastest case, and even then the speedup is small.
It is worthwhile looking at the absolute times. Let’s consider Read8_Write16_SSE_Unroll and look at the times:
- in L1 cache: 128 ms
- out of L1 cache: 146 ms (18 ms extra)
- out of L2 cache: 200 ms (72 ms extra)
- out of L3 cache: 430 ms (300 ms extra)
Our iteration count is 1048576 and our processor clock speed is 2.6Ghz, which gives following CPU cycles for our four cases:
- base case (L1 cache): 317 cycles
- out of L1 cache: 44 cycles extra
- out of L2 cache: 178 cycles extra
- out of L3 cache: 743 cycles extra
The extra times correspond to about 5 latencies of L2 cache, 5 – 6 latencies of L3 cache and 2 – 3 memory latencies, respectively, which is not bad, considering that we read 32 lines of cache (2048 bytes in total), and also write 32 lines of cache for each source block. The processor did a good job in either prefetching the data from memory, or overlapping several memory requests in time.
Even in the out-of-L3-cache case, we still process 2 bytes per CPU cycle and move 5 Gbytes per second, which corresponds to 19,500 streams in real time. It is less than 73,400 that we started with, but still not bad.
Why is it so fast?
Well, it isn’t really very fast – after all, speed reduced by more than three times due to cache misses. But it is faster than expected. My guess is that several factors contributed to this:
-
Both source and destination data is stored in continuous blocks. The cache lines are 64 bytes long, and these lines are read fully when any one byte inside the line is accessed. If that byte is the only one needed, the entire cache line load latency is used for that byte. Fortunately, we are using all 64 bytes. Only 32 cache line loads happen per block, not 2048.
-
Memory loads do not depend on previous calculations. The out-of-order scheduler can start memory transaction while previous transaction or manipulation with its result is still in progress. This would be impossible if new memory address depended on previously read values, as it happens when traversing a linked list
-
Both input and output blocks are allocated in sequence, which makes it possible to detect memory access pattern and perform a prefetch.
-
Input and output locality reduces possible penalties for TLB misses.
These conditions are not always met, so we can’t expect to be so lucky every time. Some programs will suffer much more from cache misses (I’ll try to build some examples).
Conclusions
-
Memory caching has significant effect on program performance.
-
This means that performance testing must be done in realistic environment – the cache hit/miss scenario must correspond as closely as possible to the one expected in production run.
-
Still, in some cases the effect of caching isn’t as bad as we expect. Performance degradation by three times doesn’t justify broad statements such as “Memory is the new disk, cache is the new RAM” (such as here). Perhaps, for some problems but not for all of them.
-
Memory access problems do not necessarily invalidate optimisations. In our case optimised versions ran only four times faster than unoptimised instead of twelve, but even four times gain isn’t too bad.
-
However, extreme optimisation effort may become unnecessary. There is no point spending huge effort to improve execution time from 121 ms to 119 ms when cache misses add another 300 ms. Moreover, in our case some highly optimised versions were slightly slower under out-of-cache conditions.
-
In our example major drop in performance (3.4 times) happens when running out of L3 cache. L1 and L2 caches gave much smaller penalty (14% and 56%). This means that in our case and similar cases, while fitting into L1 cache is desirable, the primary focus must be on fitting into the L3 cache. Fortunately, modern days’ sizes of L3 caches make it possible. While keeping all the data for any realistic job in 32K or 256K is problematic, 20MB of memory allows to store something meaningful (it is, after all, 32 times bigger than the entire memory of IBM PC XT). Any effort to squeeze the data into L3 cache or partition it into independently processed cache-sized blocks is a well-spent effort.
-
One mustn’t forget that only L1 cache has separate areas for code and data (32K for each on the Sandy Bridge). Other caches are shared between code and data, so very long code may reduce performance by evicting valuable data from cache. Other way around (data evicts code) is also possible.
-
One must also remember that L3 cache is shared between all the processor’s cores. Leave a bit of cache to other threads!
-
It is, however, not shared between multiple CPUs. This is good, because we have more cache on multi-CPU system. However, if one thread prepares some data for processing by another thread, extra memory access will happen if that other thread is running on different CPU. One may need some manual affinity control to prevent this from happening.
Coming soon
I’m going to check impact of caching on read and write operations separately. I’d also like to check what happens if memory access is not sequential, and the blocks are processed in some other order, such as reverse, strided or random. I’m also going to build an artificial example that achieves the highest possible performance degradation due to cache misses.