Today’s topic may seem trivial and not worth talking about: it is rather obvious that performance measurements are affected by the CPU clock speed. However, the details of the story were interesting to me, that’s why I’d like to share them.
I had to run some calculation on multiple cores and needed to choose the best way to split the work between threads and arrange inter-thread communication. I was trying various options and measured the overall performance as a function of the number of threads, within the available number of processor cores. The performance of each thread dropped as the number of threads increased. Usually, this is expected, because few tasks are perfectly parallelisable. There is always some synchronisation overhead, inter-thread dependency, resource contention or other reasons why two threads do not do twice as much work as one. I wanted to minimise these effects, but whatever I tried didn’t help. The performance always dropped.
I started simplifying the program until it became ultimately simple: just ordinary loop with some arithmetic calculations.
The test
This is the simplified program:
import java.util.ArrayList;

public class ThreadTest extends Thread
{
    @Override
    public void run ()
    {
        final int N = 1000000000;
        double sum = 0;
        long t1 = System.currentTimeMillis ();
        for (int i = 1; i <= N; i++) sum += 1.0/i;
        long t2 = System.currentTimeMillis ();
        synchronized (ThreadTest.class) {
            System.out.printf ("Time: %6d; sum=%10.5f\n", t2-t1, sum);
        }
    }

    static void test (int nthreads) throws Exception
    {
        long mintime = 1000000;
        for (int count = 1; count <= 10; count++) {
            System.out.println (nthreads + ": Test #" + count);
            ArrayList<Thread> a = new ArrayList<Thread> ();
            for (int i = 0; i < nthreads; i++) {
                a.add (new ThreadTest());
            }
            long t0 = System.currentTimeMillis ();
            for (Thread t : a) {
                t.start ();
            }
            for (Thread t : a) {
                t.join ();
            }
            long t = System.currentTimeMillis () - t0;
            System.out.printf ("Total time: %6d\n", t);
            if (t < mintime) mintime = t;
        }
        System.out.printf ("%2d: mintime = %6d\n", nthreads, mintime);
    }

    public static void main (String [] args) throws Exception
    {
        test (Integer.parseInt (args[0]));
    }
}
The way to keep threads busy isn’t important, as long as they don’t depend on each other. The test is performed several times (the minimum of all times is used as a result), for two reasons: to make sure HotSpot warms up completely and compiles everything it needs, and to make sure the processor fully wakes up from the energy-saving mode and reaches its full speed.
This last issue is very important, since our processor reports the following line in /proc/cpuinfo:
model name : Intel(R) Xeon(R) CPU E5-2620 v3 @ 2.40GHz
and a typical value for the current CPU speed (extracted from the same file) is
cpu MHz : 1200.187
It is important to study the /proc/cpuinfo before running the tests. In our case this file shows that the machine has 24 cores. The cores with even numbers belong to the physical
processor 0, while those with odd numbers belong to the processor 1. The cores 12 to 23 are the hyper-threading buddies of the cores 0 to 11. We want to exclude those,
that’s why we’ll run our tests like this:
taskset 0xFFF java -server Threadtest n
(where n is the desired number of threads)
The results
The following graph shows the minimal time of ten tries that it takes to finish all the threads, for the thread count between 1 and 24:
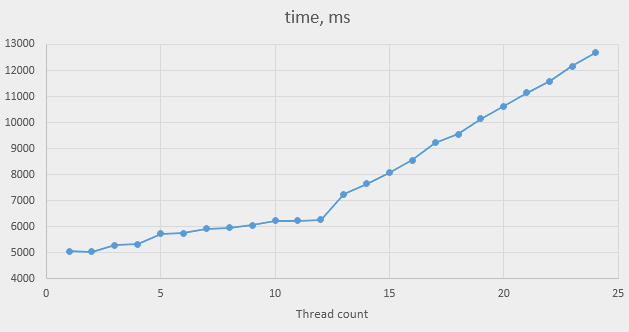
Since we have twelve physical cores, we expect linear slowdown for thread counts above 12, and this is indeed what we see. However, the difference in performance between one thread and 12 threads can’t be explained by shortage of cores. It can’t be attributed to inter-thread synchronisation either, because there is none. It can, however, be linked to the difference in CPU speed. Let’s look at the speeds of cores when running one thread:
[root@testhost ~]# grep MHz /proc/cpuinfo
cpu MHz         : 3187.218
cpu MHz         : 1200.093
cpu MHz         : 1200.093
cpu MHz         : 1299.911
cpu MHz         : 1395.281
cpu MHz         : 1200.093
cpu MHz         : 1200.468
cpu MHz         : 1200.187
cpu MHz         : 1201.875
cpu MHz         : 1200.000
cpu MHz         : 1253.718
cpu MHz         : 1227.750
cpu MHz         : 3176.812
cpu MHz         : 1200.187
cpu MHz         : 1200.281
cpu MHz         : 1236.843
cpu MHz         : 1200.281
cpu MHz         : 1200.656
cpu MHz         : 1212.093
cpu MHz         : 1200.375
cpu MHz         : 1200.750
cpu MHz         : 1200.562
cpu MHz         : 1200.375
cpu MHz         : 1200.843
All the cores are idling at 1.2 GHz, except for cores 0 and 12 (core 0 of processor 0 and its hyper-threading buddy), which run at 3.18 GHz – way higher than the claimed 2.40 GHz.
As the number of threads increases, the frequency drops, sometimes showing complicated patterns, such as some cores running at 3.2GHz and others at 2.8GHz. By the time the thread count reaches 12, we get more or less the expected picture:
[root@testhost ~]# grep MHz /proc/cpuinfo
cpu MHz         : 2599.968
cpu MHz         : 2599.968
cpu MHz         : 2599.968
cpu MHz         : 2599.968
cpu MHz         : 2599.968
cpu MHz         : 2599.968
cpu MHz         : 2599.968
cpu MHz         : 2599.968
cpu MHz         : 2599.968
cpu MHz         : 2599.968
cpu MHz         : 2599.968
cpu MHz         : 2599.968
cpu MHz         : 2599.968
cpu MHz         : 2600.062
cpu MHz         : 2599.968
cpu MHz         : 1200.000
cpu MHz         : 2599.781
cpu MHz         : 2599.968
cpu MHz         : 2600.718
cpu MHz         : 2599.968
cpu MHz         : 2599.968
cpu MHz         : 2599.968
cpu MHz         : 2599.875
cpu MHz         : 1202.156
except the frequency is 2.6 GHz and not the nominal 2.4 GHz. By the way, most of the hyper-threading shadow cores also accelerated to 2.6 GHz, except for two that stayed at 1.2 GHz.
This is the result of Intel Turbo Boost technology. It allows very busy cores to run faster than the nominal clock rate, just like the “Turbo” button did on the PC/AT in the good old times, which boosted the clock frequency from 8 MHz to 12 MHz. Unlike that button, the Turbo Boost raises the frequency of busy cores only, and only as long as the total number of them is not too high, and some other conditions are met (for instance, the processor isn’t too hot). As the number of threads increases, the processor slowly drops the frequency, until it reaches the normal value.
The execution times show the following performance drops:
- 1 and 2 threads: run at full speed
- 3 and 4 threads: slowdown by approx. 5%
- 5 and 6 threads: slowdown by approx. 13.5%
- 7 and 8 threads: slowdown by approx. 17.5%
- 9 threads: approx. 20 %
- 10 to 12 threads: 23.5%
Obviously, the exact figures may differ on different processor models. It may differ even on this processor in other conditions, e.g. at other processor temperatures. One example of such dependency is visible in our data. All the results are reported for two thread counts (such as 5 and 6 threads), because our system has two physical processors, and Linux tries to keep processors equally busy when allocating threads to cores. The result for 9 threads falls out of the pattern. Additional tests show that it is actually the result for 10 threads that falls out: the same test the next day showed the same 20% as for 9 threads. Probably, one of the processors was unusually hot when I ran the tests the first time.
What to do
Why do we have to do something about it at all? The processor doesn’t in fact slow down when there are many threads; rather, it speeds up when there are few. This is great and, surely, we should be happy with it – unless the extra heat generated is a problem. In this case we should consider re-configuring the CPU speed control in BIOS or even using some lower-spec processor (or even non-Intel processor at all). Since the speed is dropped in small steps, it never happens so that adding an extra thread drops the total performance. For instance, adding another threads to six threads increases the thread count by 17%, while the performance of each thread is only decreased by 3%.
However, this situation makes performance measurements much less accurate, which complicates optimisation work. In the real-life programs, the threads aren’t fully independent from each other, and adding more threads may affect the performance negatively; we can’t measure the effects of this if the performance was artificially boosted when there were fewer threads. Besides, as we’ve seen with 9 and 10 threads in our test, this performance boost is never guaranteed, so it is not wise to rely on it when dimensioning the system.
I think the correct approach would be to switch the turbo boost off, perform all the measurements and optimisations, dimension the system for this case and then turn it back on and enjoy whatever performance bonus we get.
Loading the cores
If one doesn’t have full control of the system, there is always a poor man’s solution: to load all the cores with something while performing the measurements.
This has its own drawbacks and isn’t always applicable, but in
simple cases, such as ours, it works. Let’s modify the main loop in test in the following way:
static void test (int nthreads) throws Exception
{
    long mintime = 1000000;
    for (int count = 1; count <= 10; count++) {
        System.out.println (nthreads + ": Test #" + count);
        ArrayList<Thread> a = new ArrayList<Thread> ();
        for (int i = 0; i < nthreads; i++) {
            a.add (new ThreadTest());
        }
        for (int i = nthreads; i < NCORES; i++) {
            a.add (new Thread () {
                @Override
                public void run () {
                    while (true);
                }
            });
        }

        long t0 = System.currentTimeMillis ();
        for (Thread t : a) {
            t.start ();
        }
        for (int i = 0; i < nthreads; i++) {
            a.get(i).join ();
        }
        long t = System.currentTimeMillis () - t0;
        for (int i = nthreads; i < a.size(); i++) {
            a.get(i).stop ();
            a.get(i).join ();
        }
        System.out.printf ("Total time: %6d\n", t);
        if (t < mintime) mintime = t;
    }
    System.out.printf ("%2d: mintime = %6d\n", nthreads, mintime);
}
Here NCORES equals the number of physical cores and may be hard-coded or calculated programmatically by studying the /proc/cpuinfo.
Running this, we see that top shows 100% utilisation of cores 0 to 11, /proc/cpuinfo shows 2.6GHz on all the cores, and the execution times are very close to
each other (around 6200 ms) for all thread counts between 1 and 12.
Note on using Thread.stop(): this function is deprecated. More correct would be to introduce a volatile flag and test it inside the dummy thread bodies. However,
my tests shows that the clock speeds in this case do not always drop – probably, the cores that are often blocked by memory reads are not always considered busy enough
to prevent other cores from boosting their speed.
It means that the dummy threads solusions is not fully reliable either. The proper way to do performance testing is still disabling the Turbo Boost.
Disabling the Turbo Boost
One way of disabling the Turbo Boost is in BIOS. Alternatively, you can do it by writing the appropriate value into the file
/sys/devices/system/cpu/intel_pstate/no_turbo (the string “0” means turbo boost is on, “1” means it is off). This only works on some systems (it needs some driver
to be installed), and requires root access.
Changing this setting achieves the similar effect to running the extra threads, except the CPU frequency becomes 2.4 GHz on all the busy cores, and the times (very close to each other for different thread counts) become a bit higher (6800 ms in our case). This means that the clock speed of 2.6GHz we observed when running 12 threads was in fact also the result of the turbo boost. Some other time (for instance, when the processor runs a bit hotter), the frequency may drop to the nominal 2.4GHz, which means that it is the latter value that must be used for performance measurements and system dimensioning.
The effects of hyper-threading
In the beginning I mentioned that I wanted to exclude the hyper-threading from the test. How does it affect the results? Let’s switch the turbo boost back on, get back to the original code (without dummy threads) and run two threads on the same core:
taskset 0x1001 java -server Threadtest 2
We see that the selected core is running at the high speed (3.1GHz), but the overall execution time went up to 9000 msec from 5050 msec. This shows that the hyper-threading cores do indeed share some resources (in our case, most likely, the floating point execution unit).
Whether hyper-threading is worth to be used at all, or if it must be switched off completely, is a subject of a long and never-ending debate. Just like the turbo boost, the hyper-threading will never make the overall system performance less (provided that the inter-thread communication won’t eat up all the benefits of the extra threads), but it may increase the individual threads’ response time. This means that the hyper-threading must be switched on or off depending on the requirements of the software (maximal throughput vs minimal latency). The performance measurements must be done on the same settings as on the target system (switching the hyper-threading off can be simulated by choosing the appropriate affinity mask).
Conclusions
-
The modern Intel processors are capable of running faster than the nominal CPU speed, as long as the number of cores used is small
-
This feature, being generally great, creates difficulties when measuring performance and optimising multi-threaded programs
-
The benefits of this feature are substantial but unreliable; one can never trust that the real CPU speed will reach the turbo values; this means that the system dimensioning is better to be done without that feature in mind.
-
It is better to switch this feature off (properly or in a simulated way), perform all the optimisations and then switch it on again when deploying the system (unless there are considerations, such as energy saving, that prevent from switching it on even then)
-
We haven’t performed an extensive study of hyper-threading, but the results we’ve got show that this is a controversial feature that isn’t beneficial for all the applications. Perhaps, we’ll study the effects of hyper-threading in more details later.